There are more insights tools available for free online than most people know about. In this post I list 12 of my favorite ones from Google and go a bit deeper into one of them.
Below is a list of the 12 tools including a short description and link to each tool.
Before diving into the tools, it’s important to recognize that not all data is created equal. What is great with search data from Google:
- It’s a lot of data – Considering that people search on Google more than 100 billion times/month, it’s arguably the biggest source of data out there, which in many cases makes it very relevant
- It’s real time data – Google’s search data is happening in real time, so if someone was interested in a topic a week ago, they may or may not still be interested, and this data helps answering that question unlike data where people stated their interests a year ago to look good
- It shows unbiased intent – This is probably the biggest strength of the data, but it shows real intent – People don’t search on Google to try to look good, they search for exactly what they want when they want it
Other data sources have other benefits, but these are the biggest benefits of search data from Google on which several of below tools are built.
The first of the tools is probably the one I use the most, Google Trends [link]. This is all Google search data worldwide put into one tool. Pretty cool! It can help answer questions such as:
- Do consumers find Brand A or Brand B more interesting?
- When is the seasonal peak for Industry A?
- Is Brand B more popular in Sweden or in Norway?
- Where in Sweden is the consumer interest highest for Industry A?
- What are the consumers searching for related to Industry A and how has that changed during the last week?
- What is the most popular search term on YouTube last month?
- What questions are people asking related to Industry A?
So, lots of questions can be answered. Google trends shows normalized query trends. If the search data was not normalized, regions with the most search volume would always be ranked highest. Normalized data means that sets of search data are divided by a common variable, like total searches. So if a search trend goes up, it really goes up, it’s not just because people have been searching more in general.
So for example, let’s say you have a business that sells things to parents in the UK with small children and you want to find out what they look for online. Then you can for example start by adding a set of words linked to this group of people:

As you see in this example toys peaks during Christmas (no surprise), but what perhaps is a surprise is that pregnancy dwarfs everything else linked to this category. So if to develop relevant content linked to your webshop for new parents, pregnancy-related content should probably be at the top of the list.
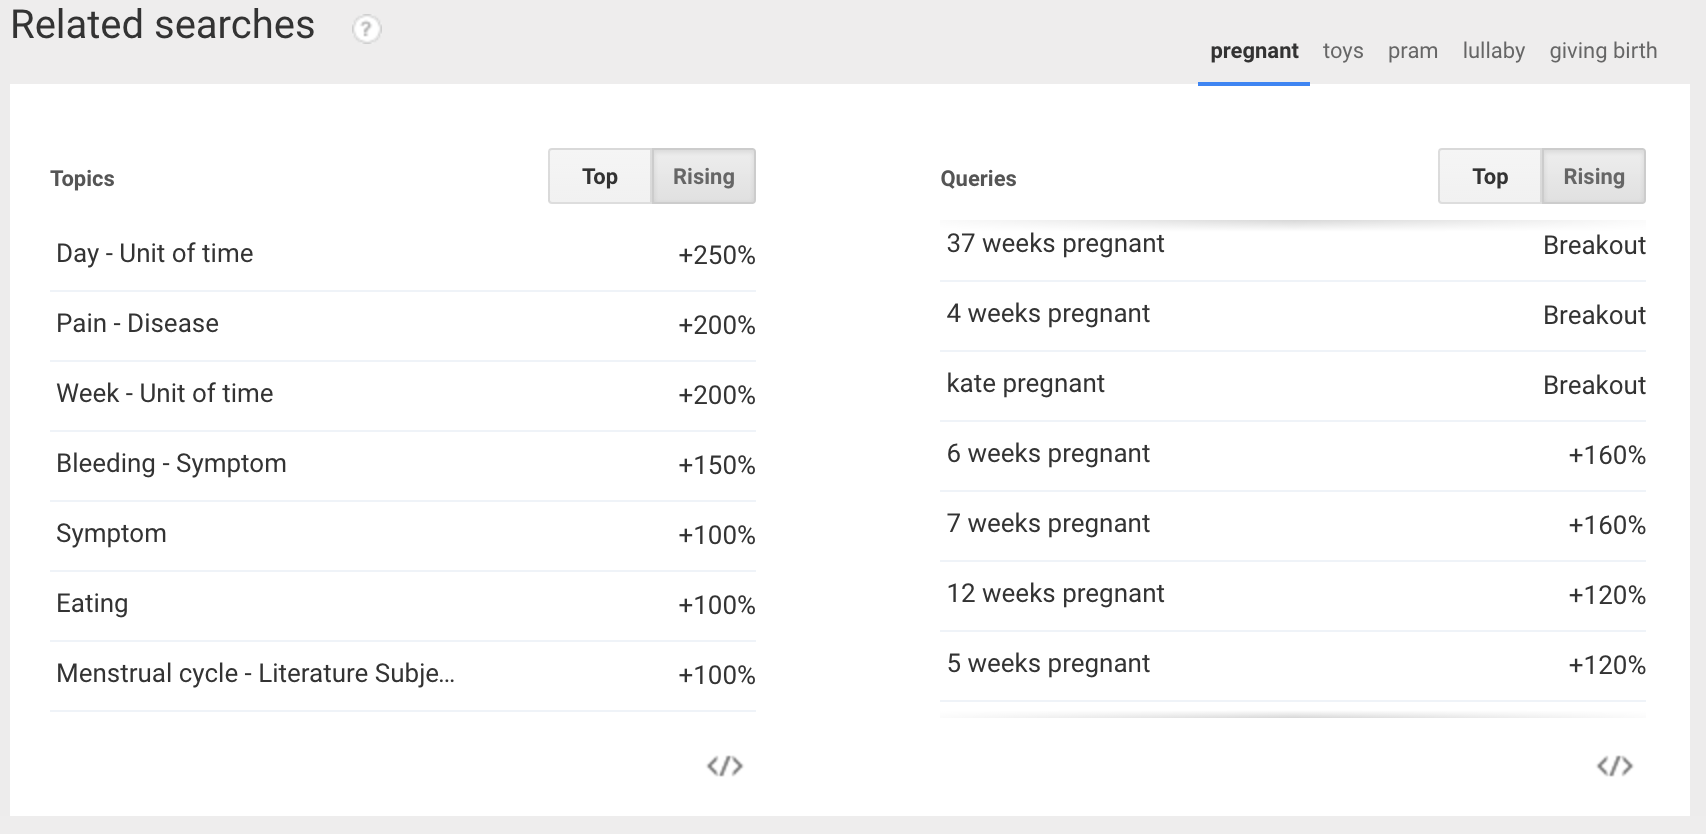
As a next step you can look at what the main topics are linked to pregnancy that people look for, what is trending etc. Like in below case it’s clear that the fastest rising area among the major areas is linked to the week of pregnancy you’re in. So from a relevance point-of-view, the first content you should probably look at developing is the best pregnancy calendar out there. That took less than 3 minutes to find out.

You can use Google Trends to continue dive into the behavior of people linked to your industry, and there are many functions in Google Trends that you’ll learn to use once you get started. And that’s the most important thing when it comes to using online data for insights… getting started.
So as a next step, take a look at below list of free insights tools and start playing around with them. Keep it simple, think BIG and have fun!
Trends [link]
Google’s most powerful insight tool that in real-time shows people’s search behavior
Think with Google [link]
Hub of choice including case studies, trends & research reports across industries, platforms and products
Consumer Barometer [link]
Lots of data on consumer purchase paths, device usage, consideration and viewing behavior across countries
Consumer Surveys [link]
A market research tool where you can ask up to 10 questions including imagery and videos – Fast, accurate, visually appealing insights in real-time and significantly cheaper than most others
Display Planner & Keyword Tool [link]
Keyword tool gives search volume estimates, breakdown by device and keyword ideas, while Display Planner is used to scope size of different audiences
(Über)suggest [link]
When you start typing in Google search bar you’ll already get insights into most common searches – Über suggest digs even deeper (not a Google tool by uses Google API
Google Analytics [link]
Helps you analyze your brand websites visitor traffic by platform and paint a complete picture of your audience and their needs, wherever they are along the consumer journey
YouTube Analytics [link]
Helps you analyze every aspect of a YouTube channel; demos, audience retention, video popularity etc
BrandLift [link]
Measures lift in brand awareness, ad recall, interest (search uplift) – More measures are continuously added
Correlate [link]
Finds correlations in search patterns between a word of choice and other searches – Same logic as what’s feeding the Google flu trends
Public Data [link]
Know anything there is to know on public data – Gathers all sorts of global public data into one place
YouTube Dashboard [link]
Track what’s being viewed and shared on YouTube by age, gender and location
